Example Usage Applied to Fracture Data - Åland Islands Networks
Data fromMulti-scale fracture networks at Åland Islands - data analysisby Nikolas Ovaskainen
Fracture data and networks is another type of geospatial product which can use the Hough Transform method. Here we see mapped segments from bedrock in Åland Islands, Finland from Ovaskainen et al., 2023.
![]()
Load in a geoJSON format which also performs preprocessing.
Perform the Hough Transform
Visualize the Results
[13]:
#Let's begin by loading the module
import linkinglines as ll

# Load the example dataset
dikeset=ll.readFile('../data/example_getaberget_20m_9_traces.geojson', preprocess=True)
3627 dropped for not being straight
The next step is to perform the Hough Transform
Besides the data the input in the hough transform code is the center (xc,yc) which is assumed to be the mean of the X and Y coordinates. It can be set arbitrarily. You may wish to set this to investigate structures in your dataset. But most people will use the default settings.
[14]:
dikeset, xc, yc=ll.HoughTransform(dikeset)

print(dikeset.columns)
Index(['Id', 'Length', 'VALIDATION_ERRORS', 'geometry', 'Xstart', 'Ystart',
       'Xend', 'Yend', 'seg_length', 'HashID', 'Xmid', 'Ymid', 'theta', 'rho',
       'xc', 'yc', 'PerpOffsetDist', 'PerpIntX', 'PerpIntY', 'Date Changed'],
      dtype='object')
Visualize the hough transform data.
[15]:
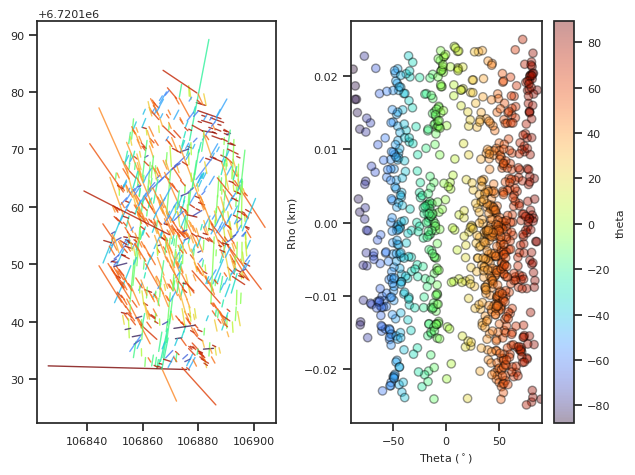
fig,ax=ll.DotsLines(dikeset, ColorBy='theta')
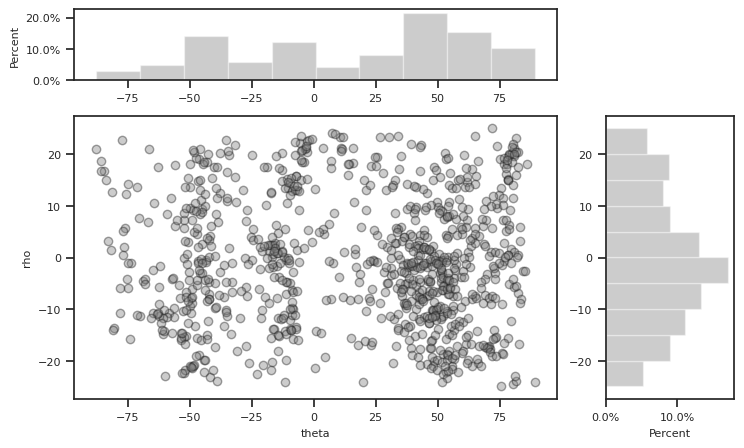
fig2, ax2 = ll.plotScatterHist(dikeset, "theta", "rho")
km scale label